【jQuery】グラフの描画をやってみた
どうも。
今回はプログラムの覚え書きです。ふとグラフの描画ってどうするんだろう?って思ったので。
色々と探して Flotr2 と言うライブラリを使うことにしました。
ライセンスは MIT License のようなので、将来的に何か作って公開することも考えると丁度いいかなと。
ディレクトリ構造
.
├── css
│    └── bootstrap.min.css
├── js
│    ├── bootstrap.min.js
│    ├── flotr2.min.js
│    └── jquery-2.0.1.js
└── index.html
index.html
<!doctype html> <html lang="ja"> <head> <meta charset="utf-8"> <meta name="description" content=""> <meta name="viewport" content="width=device-width, initial-scale=1.0"> <link href="css/bootstrap.min.css" rel="stylesheet" media="screen"> <title>サンプル</title> <style type="text/css"> <!-- .container { width: auto; max-width: 680px; } --> </style> </head> <body> <div class="container"> <div class="page-header"> <h1>Flotr2 グラフ描画サンプル</h1> </div> <div id="flotr-example-graph" style="width:600px;height:400px"></div> </div> </body> <script type="text/javascript" src="js/jquery-2.0.1.js"></script> <script type="text/javascript" src="js/bootstrap.min.js"></script> <script type="text/javascript" src="js/flotr2.min.js"></script> <script> $(function(){ var container = document.getElementById("flotr-example-graph"), // First data series: d1 = [[0, 3], [4, 8], [8, 5], [9, 13]], // Second data series: d2 = [], // A couple flotr configuration options: options = { xaxis: { minorTickFreq: 4 }, grid: { minorVerticalLines: true } }, i, graph; // Generated second data set: for (i = 0; i < 14; i += 0.5) { d2.push([i, Math.sin(i)]); } // Draw the graph: graph = Flotr.draw( container, // Container element [ d1, d2 ], // Array of data series options // Configuration options ); }); </script> </html>
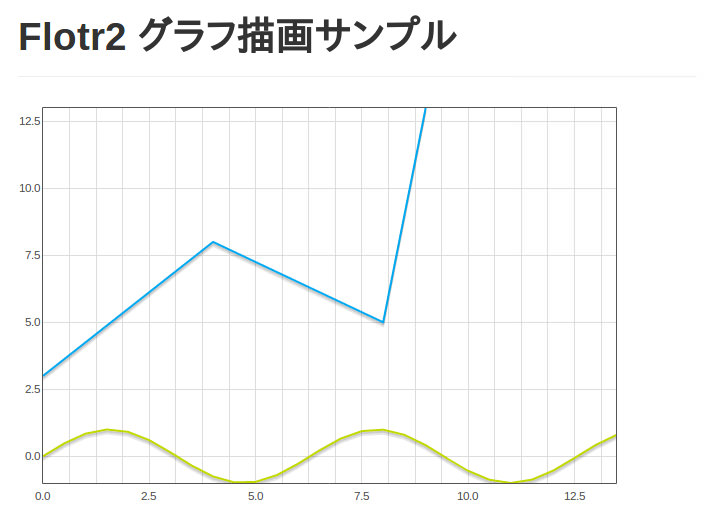
実行結果

上記のコードはデモで紹介されているものを「こう書けば動作する」っていうサンプルです。
たくさんデモがあるので「直ぐにグラフ描画できるんか、すげー!」って思ったけど、「どこにコピペしたら動作するの?」ってなりましたので・・・。
取り敢えず描画できたので、これから弄ってみようかなと。線の色を変更したり、メモリの間隔を調整したり・・・できるはずw
以上です。